|
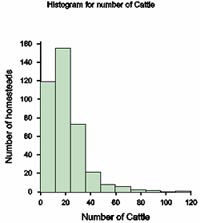
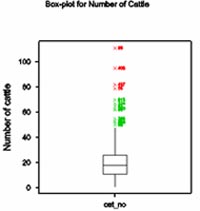
Exploration & description/Livestock species owned Next, using GenStat, restricting cat_no to >0, then applying Stats → Summary Statistics → Summarized Contents of Variates and ticking in turn the 'Histogram' and 'Boxplot' boxes in the dialog box under 'Graphics', different presentations of summary statistics for the number of cattle kept by homesteads can be obtained. The aim is to look at the distribution of the number of cattle and see what implications it may have on the data analysis.
The results show that the distribution of the numbers of cattle per homestead is skewed. From the box plot it can be seen that most homesteads possessed fewer than 25 cattle. However, a few homesteads had large numbers of cattle, some above 50 and up to 111. Hence, any statistical comparison with animal numbers may require a transformation to normalise the data. |
|||||||||||||
![]()
![]()
![]()